New endpoint. Generates a personalized training plan from a finished diagnosis — a long-running LLM job. Local development: works locally before the platform edge. Test suite: green. Deployed to production. Time for the first real-world smoke.
I clicked "Generate Plan." The browser hung. A minute passed. The response came back: 504 Gateway Timeout. The natural conclusion was that the LLM had failed somehow. I hit refresh on the dashboard.
The new plan was already there.
Two Sources of Truth Disagreed
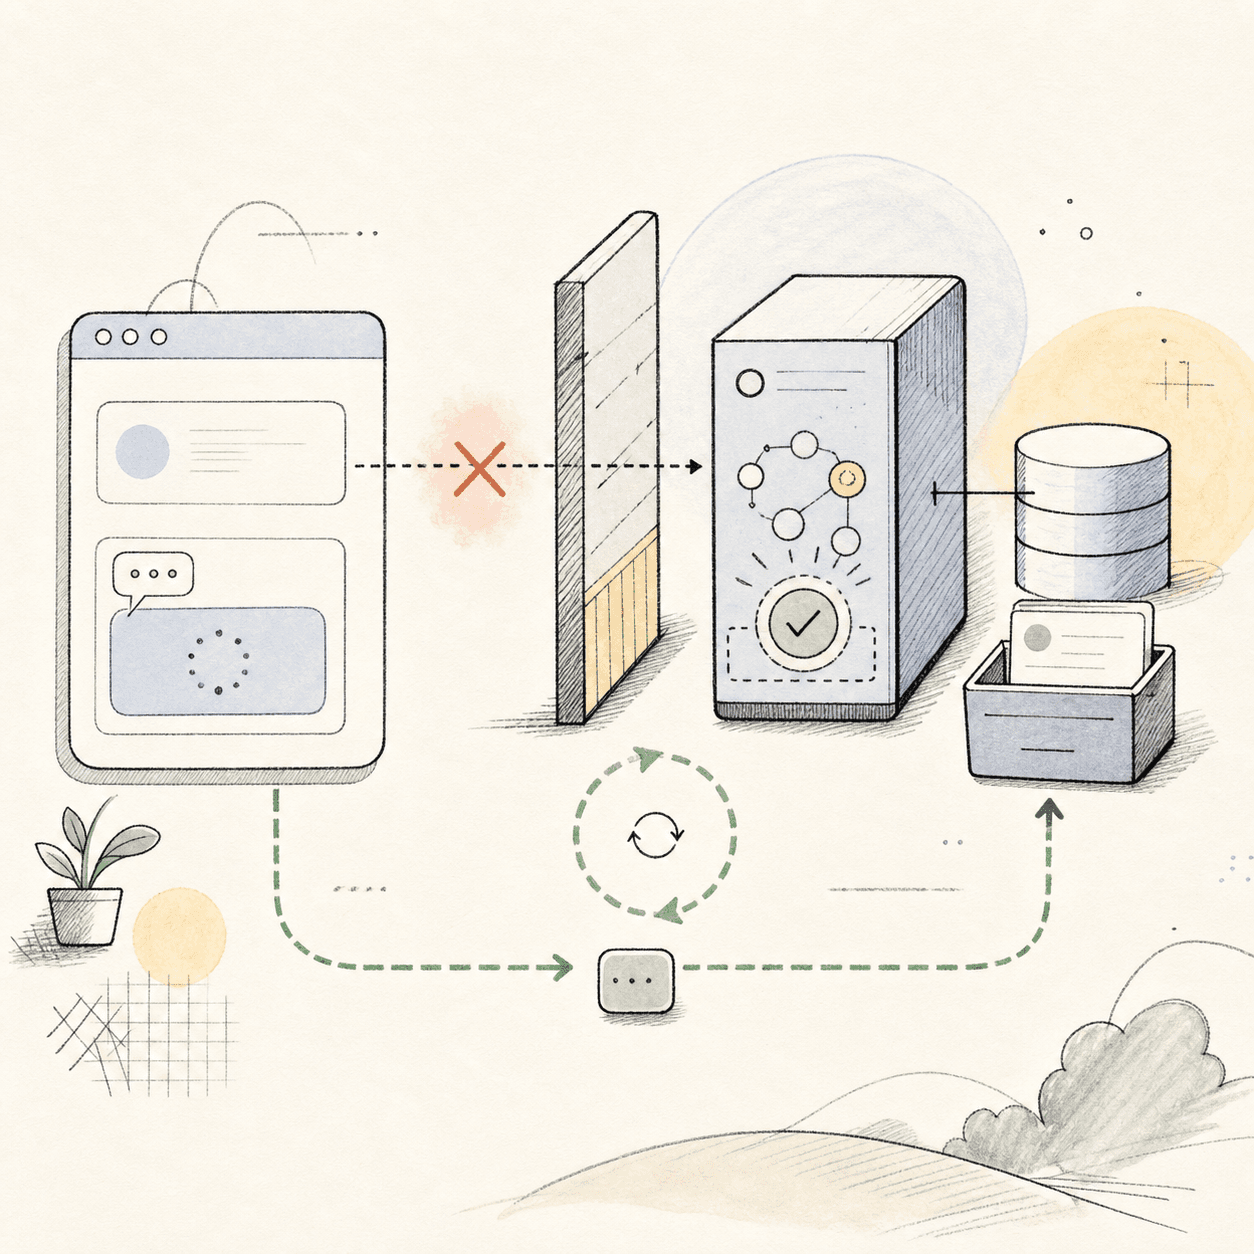
From the frontend's view, the request failed. The user saw 504. From the backend's view, everything was fine — the LLM finished, the plan was saved, the database row was written, no errors logged.
Two sources of truth disagreeing is the most diagnostic moment in software. Either one is lying or one is incomplete. My instinct was to start prodding the backend. The audit log answered first.
request failed
The user sees an error and loses trust.
job finished
The result is already saved.
what actually happened
The independent record explains the split.
What the Audit Log Said
The same audit log that saved Day 7's incident answered this one too. Every LLM call had enough lifecycle metadata and output context to reconstruct what happened.
For this request:
record: affected generation
runtime: completed just before the gateway cutoff
outcome: saved successfully
payload: normal size
The LLM had finished just before the platform cutoff. The math was now clear: the LLM finished, the backend started writing the response, the gateway killed the client connection because it had been holding too long, and the backend completed the database write into the void. The 504 was the gateway giving up, not the LLM giving up.
The Naive Fixes Wouldn't Work
Default debugging path for a 504 on an LLM call would be:
- Bump application timeout.
- Add retry logic on the client.
- Email the LLM provider blaming their latency.
None of these would have helped, because none of them touch the actual constraint. The gateway timeout is in the platform'sreverse proxy, not the application's config. It's a hidden ceiling. Bumping the app timeout just means the gateway kills the client before the app's longer timeout matters. Retry logic at the client just guarantees the same timeout happens twice.
The Fix Was Two-Pronged
Two parallel small fixes, neither glamorous, both shipped same day:
- Slim the prompt. The training-plan prompt had been carrying more context than the model actually needed to do its job. I trimmed it to what mattered. Runtime dropped below the gateway ceiling, and the prompt got cheaper as a side effect.
- Frontend abort + polling fallback.If the POST hasn't returned near the platform cutoff, the client cancels and starts polling a lightweight read endpoint that just checks: "is the cached plan ready yet?". The backend always writes the result, regardless of whether the client is still listening. From the user's view, the plan appears.
The architectural lesson: treat long-running synchronous HTTP calls as best-effort, with a polling fallback as the authoritative path. The 504 stopped being a failure mode and became an expected branch — fall through to polling, wait a few seconds, return the result.
The Audit Table Saved Me Twice
Two distinct incidents — Day 7's data deletion and Day 8's phantom timeout — were both solvable because of one architectural decision: persist enough call evidence to reconstruct behavior when the frontend and backend disagree.
Day 7: audit log made data recovery possible.
Day 8: audit log made the root cause provable in three queries.
In both cases, the cost of not having the log would have been catastrophic. The cost of having it: a few cents a day in storage and a column that no one queries until they desperately need to. New SOP entry calcified out of these two incidents: for any product that ships an LLM call, persist enough call evidence into an audit trail from day one. Day one. Not after the first incident. The first incident is exactly when you need the log you didn't write yet.
A New Checklist Item
Going forward, every new HTTP API that involves an LLM gets five questions before it ships:
- What's the platform's gateway timeout? (Not the app's — the platform's.)
- What's the realistic p95 latency of this LLM call?
- If (2) approaches (1), what's the fallback path?
- Is the LLM call's input + output written to the audit table?
- Does the frontend handle the "backend succeeded but gateway timed out" case gracefully?
If any answer is "I don't know," don't ship. Find out first. Five minutes of question-answering beats a week of phantom-timeout debugging.
Without SOP, With SOP
Bump app timeout. Add a retry. Open a support ticket with the LLM provider. Customers paying for plan generation see 504, never refresh, assume the product is broken. Churn quietly.
Audit log diagnoses the problem in three queries. The platform gateway is the constraint, not the LLM. Prompt slim + frontend polling fallback ships same day. The user sees the plan appear, even when the gateway killed the connection. The prompt gets cheaper as a bonus.
The Real Lesson
Modern deploy platforms have constraints that are invisible until they bite you. Gateway timeouts. Body-size limits. Response streaming caps. Cold-start latencies on serverless functions. None of these show up in your app config. They live somewhere in the platform's docs that you read once during setup, three years ago, and never thought about again.
The audit table is the universal solvent for this class of problem. When two sources of truth disagree, the audit table is the third source — independent of both the frontend and the application logic, recording what actually happened on the call level. Two incidents already paid back its cost. There will be more.
Build for the gateway you have, not the gateway you wish for.And log every model call. The audit table will save you twice.
Next: Day 9 — three months earlier, a collaborator pasted an .env file into an AI chat to debug a deploy. Three months later, a grep over the project's knowledge vault found the keys still sitting there. Worse: the vault syncs to the cloud, and the cloud indexes into AI search.